Garden with Insight Help: Graph weather aspects
Tutorial progress: -------------------|
Use the growcorder on the weather
Now that you know how to plant and harvest a garden, let's take a closer look at the simulation using
the graph system on the weather. Put down the seed packet, pick up the
growcorder, and click in an area of the screen that has no soil patches
or plants. The browser will appear with weather information. [If you
see soil patch information, you clicked in a soil patch. Go back to the garden window and click in an area
of the garden that has no soil patches, where the cursor is a simple arrow.  ] ]
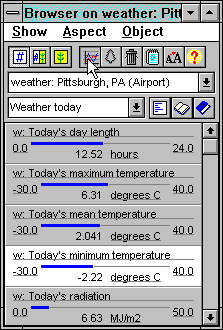
Look on the numbers side of the browser at the Weather today group
Click on the numbers side  button to see the numbers side of the browser. From the group box on
the browser, pick the group Weather today. You should see
the minimum, maximum and mean air temperature aspects for the current day of the simulation.
Graph minimum temperature
Select the browser component labeled Minimum temperature
today by clicking on it -- it will turn white. Now click on the graph  button. The graph window will appear. On top of the graph
window, the graph item options window may appear with graph
options for the aspect you chose. If it appears, click OK to accept the current settings. [If the
graph item options window doesn't appear, nothing is wrong -- it just means the option to show that
window when you first graph an aspect is turned off.] In the graph
window, the legend below the graph shows the aspect you chose. button. The graph window will appear. On top of the graph
window, the graph item options window may appear with graph
options for the aspect you chose. If it appears, click OK to accept the current settings. [If the
graph item options window doesn't appear, nothing is wrong -- it just means the option to show that
window when you first graph an aspect is turned off.] In the graph
window, the legend below the graph shows the aspect you chose.
Graph maximum and mean temperature
Return to the browser, click on the browser component labeled Maximum temperature
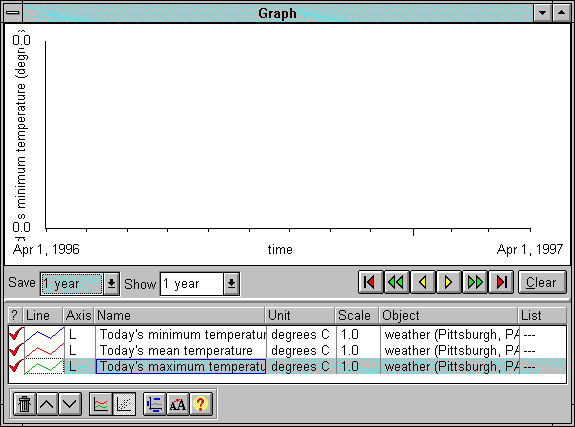
today, and click the graph  button again. Now do the same for the Mean temperature today component. Now in the graph
window, all three aspects will be shown in the graph legend. When you are finished adding the three
aspects to the graph, close the browser.
Look at the empty graph
Notice that the graph is empty. This is an important point to understand: the graph window only
starts to record aspects after you choose them. Once an aspect is chosen for graphing, its value is
recorded and graphed every day. If you remove an aspect from the list, it will stop being recorded and all
the stored values will be lost.
Collapse the garden window
Before we run the simulation again, let's make the simulation run faster. Click on the
collapse/expand  button on
the garden window to collapse the window. In the collapsed state the
garden window does not redraw the plants and soil patches. button on
the garden window to collapse the window. In the collapsed state the
garden window does not redraw the plants and soil patches.
Run the simulation
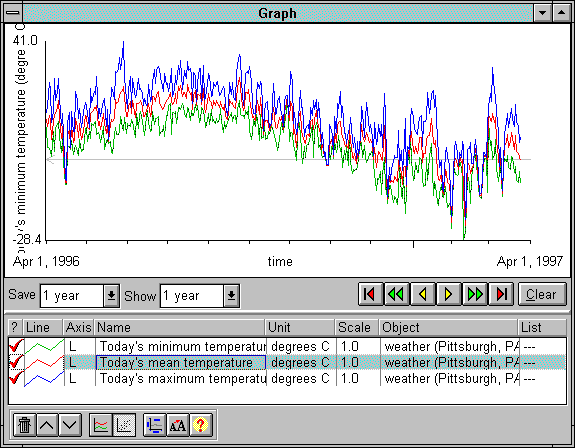
Now let's run the simulation so there is something to see in the graph. Click on the year button on
the garden window. Watch the graph as the lines begin to move across it. The legend below the graph
shows which colored line goes with each aspect. If you want to stop the simulation before the year is up,
click on any of the date buttons or the message area on the collapsed garden window.
Hide mean temperature
Suppose you want to hide the mean temperature so you can see the
range of daily temperatures more clearly. On the mean
temperature line in the list under the graph, click the check-mark. The mean temperature graph line
will disappear from the graph. Click the check-mark again and the graph line will appear again. Hiding
and showing different lines makes it easier to look at a complicated graph.
You've done it!
That's it! You've learned how to run the simulation. It's simple: plant some plants, take care of them,
and enjoy the harvest. Of course, there is much more to explore and learn. To learn more, read over
specific parts in the Reference sections of the help system.
See you in the garden!

Using the browser to graph minimum temperature

Graphing three aspects in the graph window

Hiding an aspect in the graph window
Tutorial index
| 
