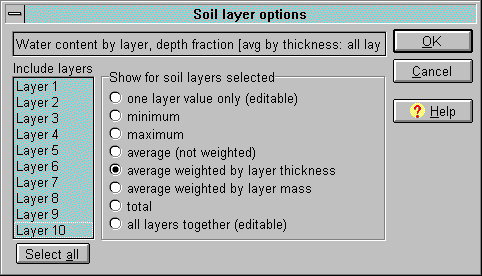
Garden with Insight v1.0 Help: Soil layer options window
Aspects that pertain to soil layers are special -- the same piece of
information is available for each layer in the soil. For example, the aspect "Temperature by
layer today" represents the temperature of each soil layer. When you view soil layer information in
the browser or graph window, you can choose several different representations.
You use the soil layer options window to control how aspects that pertain to soil layers are displayed in the
browser and graph window. You can
open the soil layer options window from the group editor (by clicking
on the Layers button when a soil layer aspect is selected) or from the graph window (by clicking
on the List column of the selected graphed aspect).

The soil layer options window
The options you can choose on the soil layer options window (under the words Show for soil
layers selected) are as follows, with reference to the list of layers under the words Include
layers. You must choose one of these options to view any soil layer aspect.
One layer value only: Show or graph the value for only one soil layer. You will be able to change
the value in the browser if the aspect is editable.
Minimum: Show or graph the smallest value among the selected layers. You will not be able to
edit the minimum in the browser.
Maximum: Show or graph the largest value among the selected layers. You will not be able to
edit the maximum in the browser.
Average (not weighted): Show or graph the simple average of values for the selected layers. You
will not be able to edit the average in the browser. The simple average is best for quantities that do not
represent amounts of material, such as temperature.
Average weighted by layer thickness: Show or graph the weighted average of values for the
selected layers based on the thickness of each layer. You will not be able to edit the average in the
browser.
Average weighted by layer mass: Show or graph the weighted average of values for the selected
layers based on the mass of each layer. You will not be able to edit the average in the browser.
The two weighted-average options give a better average for values which are based on amounts of material
such as water content or organic matter. There is actually very little difference between the two weighting
methods.
Total: Show or graph the sum of values for the selected layers. You will not be able to edit the
total in the browser. For some aspects the total is meaningless (temperature, for example), but you can
choose it anyway.
All layers together: In the browser, show all layers in a special array browser component. If you choose this option, your selection from the
layers list on the left will be ignored and you must see all the layers. You will be able to change the layer
values in the browser if the aspect is editable. This option is not available from the graph window.
To choose which layers you want to include in your summary, click on the layers in the list at the left
under the words Include layers. Select multiple layers by holding down the shift key (for layers
in a row) or the control key (for layers not in a row). Or click Select all to select all the layers.
When you add an aspect to a group, the Average weighted by layer thickness option is selected
by default, with all layers included. When you graph an aspect, the layer option is used exactly as it is in
the browser, unless the All layers together option is chosen in the browser. Graphing all
the layer values at once is not supported. In that case the Average weighted by layer thickness
option is substituted for the graph.
Click OK to save your changes to the layer options for the current aspect or Cancel to
abandon them.
See also:
How to change how a soil layer aspect is graphed
| 
