Garden with Insight v1.0 Help: How to graph two aspects that have different ranges
Sometimes you might want to compare two aspects to look for correlations and parallel trends. What do
you do when the two aspects have different ranges, like temperature [-10 to 30 degrees C] and rainfall [0.0
to 0.025 inches]? In this case one of the aspects has a range so much larger than the other aspect that one
aspect cannot be seen at all.
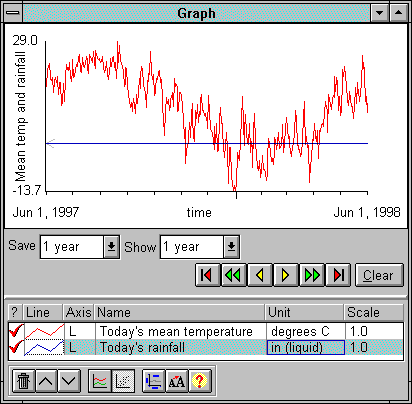
Temperature and rainfall graphed (rainfall cannot be seen)
There are three ways to arrange aspects with different ranges on the same graph. (This explanation
assumes you have already graphed both aspects.)
Change the units
The easiest way to solve this problem is sometimes just to change the unit of one of the aspects. While inches might not line up with degrees C,
millimeters would be closer. To change the unit, click on an aspect's line in the list box under the graph,
in the Unit column.
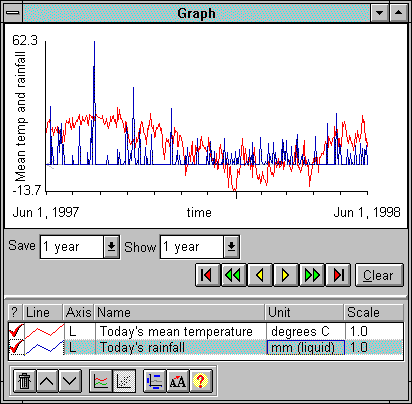
Temperature and rainfall graphed with rainfall in millimeters
Change the axis
You can also solve this problem by switching one aspect to the opposite axis. To do this, look at the
graphed aspect's line in the list box under the graph, in the Axis column. The contents of that
column will be a single letter, L or R. Each time you click in that column, the aspect
will switch from the left to the right axis or vice versa. Click in the axis column to switch one of your
aspects to the right axis; autoscaling should make the two lines come closer together.
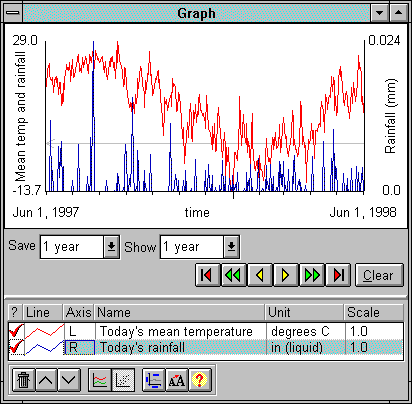
Temperature and rainfall graphed with rainfall on the right axis
Change the scale multiplier
Another solution is to scale one of the aspects when it is graphed so that its values more closely
match the other aspect's values. In the list box under the graph is a column labeled Scale. The
values in this column are usually 1.0; that number is a multiplier for every graphed value. In the example
above, changing the scale for rainfall to 1000.0 would bring the range for rainfall to [0.0 to 25.0 inches],
comparable to temperature [-10 to 30 degrees C]. To change the scale, click on an aspect's line in the list
box in the Scale column. The graph item options window will
appear.
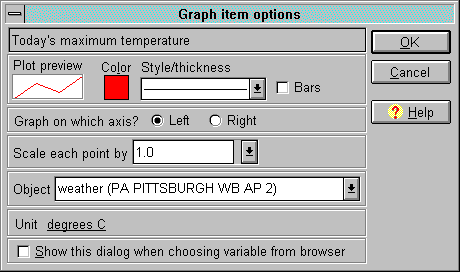
The graph item options window
In the graph item options window, after the words Scale each point by is a combo box. You can either type in a scale in this box, or click on the arrow
at the right of the box and choose one of the values in the list that appears. Click OK to save
your change.
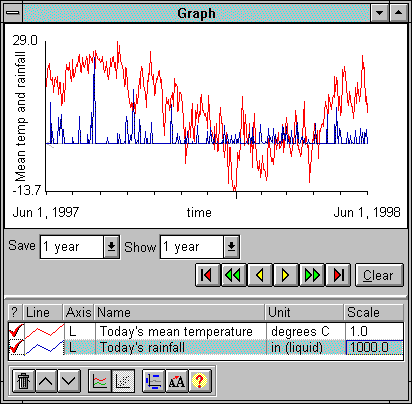
Temperature and rainfall graphed with rainfall multiplied by a scale of 1000.0
| 
