Garden with Insight v1.0 Help: How to graph an aspect
To graph an aspect, first open the browser and choose its numbers side by
clicking on the numbers side  button. Select an aspect by clicking on its browser component, then do
one of four things:
 click the graph click the graph  button at the top of the browser, or button at the top of the browser, or
 choose Graph from the
Aspect menu of the browser, or choose Graph from the
Aspect menu of the browser, or
 type Control-G, or type Control-G, or
 click on the name of the browser
component and drag to the list box under the graph on the graph window. click on the name of the browser
component and drag to the list box under the graph on the graph window.

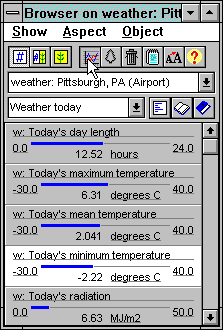
Graphing an aspect from the browser
If nothing happens, it means that you cannot graph the aspect you have selected. You can only graph
single numbers (real numbers or integers), or arrays of soil layer values. You will usually use the graph
window to graph output values (e.g., temperature, water erosion, plant biomass). You can graph values that you have input yourself (e.g., soil
patch slope), but the line on the graph will be flat unless you change
the value yourself.
If the aspect was graphed successfully, the graph window will appear
(if it was not visible), and on top of it will appear the graph item options
window. If the graph item options window appears, click OK to accept the current settings.
If the graph item options window doesn't appear, it means that the option to show that window when you
first graph an aspect is turned off.
On the graph window, the list box below the graph will have added a new line listing the graphed aspect
you chose. When you run the simulation, a line showing data for that graphed aspect will appear on the
graph.
For more information on changing options for the graphed aspect, see other How to entries under Graph or see the section on the graph window.
| 
