Developers of custom software and educational simulations.
|
Note: This page is no longer being maintained and
is kept for archival purposes only. For current information see our main page. |

|
Kurtz-Fernhout Software Developers of custom software and educational simulations. |
| Home ... News ... Products ... Download ... Order ... Support ... Consulting ... Company |
|
PlantStudio Product area Help System Index Introduction Quick Tour Tutorial Wizard Arranging Breeding Nozzles/tubes Animations DXF Parameters How it works Strengths/limits Registering |
Using S curve parameter panels
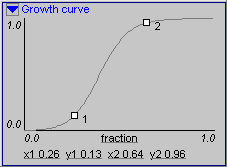
An S curve parameter panel shows a graph with an S-shaped curve on it. These
curves are used for only three parameters: overall growth, leaf growth, and
fruit growth.
 The name labels the parameter. The four values (for x and y values for the two points) are at the bottom of the graph. The x
and y bounds are at the start and end of each axis. The two points are shown by squares and labeled 1 and 2.
To change a value in an S curve parameter panel,
|
|
Updated: March 10, 1999. Questions/comments on site to webmaster@kurtz-fernhout.com. Copyright © 1998, 1999 Paul D. Fernhout & Cynthia F. Kurtz. |