Developers of custom software and educational simulations.
|
Note: This page is no longer being maintained and
is kept for archival purposes only. For current information see our main page. |

|
Kurtz-Fernhout Software Developers of custom software and educational simulations. |
| Home ... News ... Products ... Download ... Order ... Support ... Consulting ... Company |
|
PlantStudio Product area Help System Index Introduction Quick Tour Tutorial Wizard Arranging Breeding Nozzles/tubes Animations DXF Parameters How it works Strengths/limits Registering |
How a plant grows
Biomass simplification
When we started working on PlantStudio we were going to include explicit
measures of plant biomass (as dry weight) for the total plant at maturity and for each plant part. For
example, a tomato plant might have a total above-ground dry weight of 0.8 kg,
with 0.5 kg taken up by fruits, 0.2 kg taken up by leaves, and 0.1 kg taken up
by stems. But at some point we realized that this numerical accuracy is
unnecessary and inconvenient if all we want to do is draw the plants. So PlantStudio
simply sets the maximum expected plant biomass at 100% and treats all biomass
amounts as percentages of the total. It doesn't matter if you are growing a 10-foot shrub or a tiny two-inch flower; you set
the parameters in the same way.
Overall growth
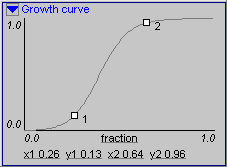
PlantStudio uses a simple S-curve to simulate the overall growth of plants,
with the top of the S-curve at 100% maximum plant biomass (MPB). This is
determined by the General: Growth curve parameter.
 Each day of a plant's life, PlantStudio calculates new growth simply by figuring the change in
total plant biomass along the plant's growth S-curve. The number of days in a plant's life is determined by the General: Age at maturity parameter.
About S curves
A typical S curve has an exponential portion in which the slope increases, an
inflection point where the slope begins to decrease, and a rounding-off portion
where the slope is decreasing. The reason these are called S curves is that
they look roughly like an S laid on its side. S-shaped curves are seen often in
nature because they represent a fairly good abstraction of the course of a
self-limiting process such as the growth of an organism or population in a limited
environment.
For example, if two rabbits were placed on an island with no predators but a
limited food supply, the number of rabbits would increase exponentially for a
time (as long as there was plenty of food), then slow down and finally round off
at the carrying capacity of the island -- the number of rabbits the island could accommodate. In a sense, you can think
of the parts of a plant like these rabbits -- they compete for the available photosynthate (energy converted from solar
energy through photosynthesis) and nutrients (absorbed through the roots).
Allocation of photosynthate and nutrients
The PlantStudio plant growth model assumes nutrients (and water) are never
limiting. (The effect of limiting these things would be a good addition to a
future version.) PlantStudio divides up new growth each day in two steps: first
between the vegetative and reproductive pools, and second between individual plant
parts in each pool.
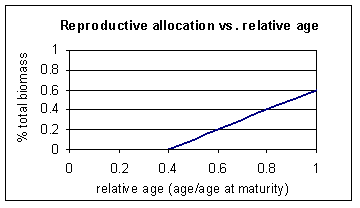
The first allocation, between vegetative and reproductive pools, works by a
simple linear increase in allocation to reproductive structures over time.
 The parameter General: Age at which flowering starts determines when this line starts to climb (here it would be 0.4), and the
parameter General: Fraction of total plant biomass at maturity in reproductive structures determines the end point of the line (here it would be 0.6).
The second allocation is covered in the section How plant biomass is distributed among plant parts.
|
|
Updated: March 10, 1999. Questions/comments on site to webmaster@kurtz-fernhout.com. Copyright © 1998, 1999 Paul D. Fernhout & Cynthia F. Kurtz. |