Garden with Insight
Product area
Help System
Contents
Quick start
Tutorial
How-to
Models
|
Garden with Insight v1.0 Help: distribution
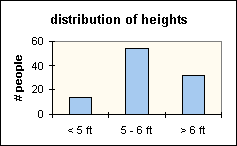
This is one of the most important words in statistics. Imagine that one hundred people are milling around
in a room. Someone with a loudspeaker tells everyone to line up by their height: people shorter than five
feet in one group; people between five feet and six feet in another group, and people taller than six feet in
a third group. Now if you count the number of people in each group and make a bar graph of the counts,
you will have a distribution of the heights of the people in the room.
So a distribution is merely a count of the number of some things falling into each category. (Actually the
proper term is a frequency distribution, because it is a distribution of the frequencies of
each height.) Distributions are important tools for examining the nature of variation. In
our height example, if the group of people less than five feet tall was larger than any other group, it might
tell us that this population was not a typical cross section of humans (perhaps this is a group of 12-year-
olds). Examining and comparing distributions like this is one of the central tools of science. Distributions
have properties (a mean, and if the distribution is normal, a standard deviation and skew) that are used to categorize and compare variation.
This simulation uses distributions extensively, mostly in the weather simulation part. The means, standard
deviations, and skew coefficients in the weather parameters refer to
properties of distributions of temperature and other weather variables over 20-30 years. For
example, the long-term standard deviation of maximum temperature for February in any climate is an index of the width of the distribution of February maximum temperatures
for each year of the 20 or 30 years of climate data.
|
