Garden with Insight v1.0 Help: Browser pictures side with plant - stresses
When a plant or cultivar is selected in the browser, the pictures side of
the browser is showing, and the display mode of stresses is selected, the browser displays a 3D
drawing of the selected plant.

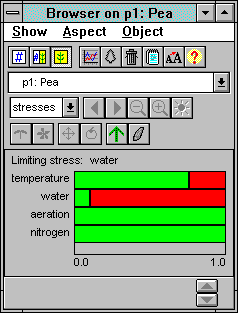
The browser pictures side showing plant growth stresses
This display is not very complicated: it shows the five stress factors
that simulate constraints on above-ground plant growth (root growth constraints are not shown here). Put
simply, temperature stress occurs when it is hot or cold; water stress occurs when the soil is dry; nitrogen
stress occurs when there is little soluble N in the soil layers where the plant has roots; and phosphorus
stress occurs when there is little soluble P in the soil layers where the plant has roots. The most limiting
(worst) stress is shown at the top.
The way these stress factors are used is that the most limiting stress (the one with the lowest stress
factor) is multiplied by the potential new biomass to get the actual new biomass. So since these stress factors are
multipliers, they go from 1.0 which has no effect (no stress) to 0.0 which has the effect of
canceling any new growth (very bad stress).
The plant will also show some signs of stress in its drawing. The leaves of a water-stressed plant will wilt.
The older leaves of a nitrogen-stressed plant will appear yellowish. The newer leaves of a phosphorus-
stressed plant will appear dark green.
Note that if you have chosen optimal growing conditions either for the
whole garden (in the simulation options window) or for a particular
plant (in the browser's numbers side), some or all of these stresses
might never fall below 1.0.
How it works: calculation of potential biomass increase, aeration stress, temperature stress, general growth constraint, root growth
constraints, actual new biomass
| 
